Statistics play a crucial role in both Major League Baseball (MLB) and production factory environments, albeit in different contexts. Let’s look at how data collection, analysis, and application in these two fields can be compared, highlighting their similarities and differences.
1. Types of Data Collected
Major League Baseball:
MLB utilizes a vast array of statistics to evaluate player performance, team effectiveness, and game outcomes. Key categories of data include:
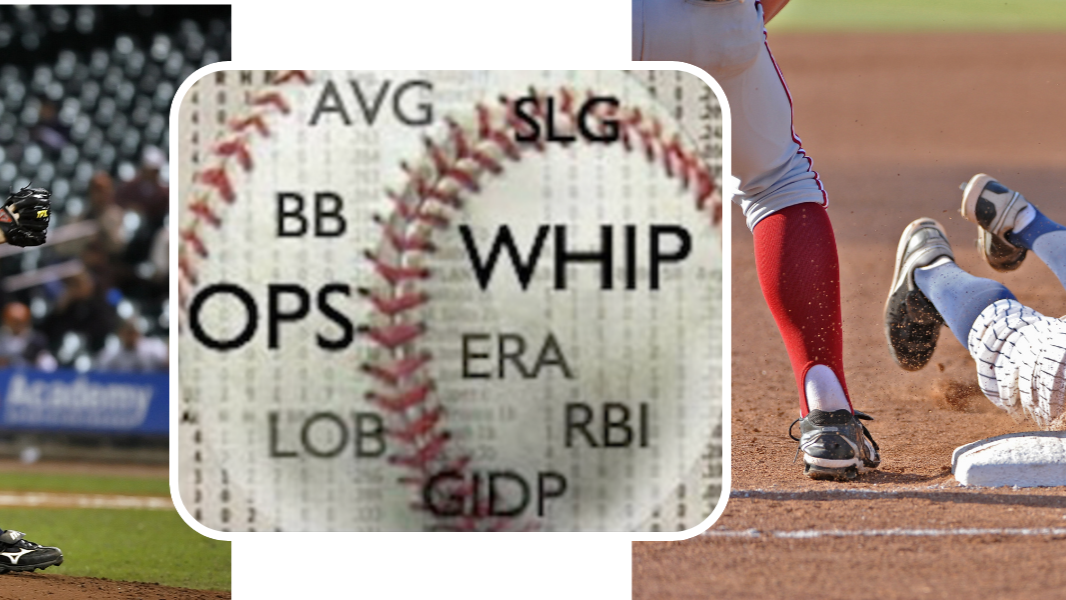
- Player Statistics: Batting averages, home runs, on-base percentage (OBP), slugging percentage (SLG), earned run average (ERA), and Wins Above Replacement (WAR).
- Game Data: Scores, pitch types, game conditions, and player positions.
- Advanced Metrics: Sabermetrics, which includes analytics like Fielding Independent Pitching (FIP) and Weighted Runs Created Plus (wRC+), offering deeper insights into player contributions.
Production Factory:
In a factory setting, data collection is essential for monitoring productivity, quality control, and efficiency. Common data points include:
- Production Metrics: Output rates, cycle times, and downtime.
- Quality Control: Defect rates, scrap waste rates, and inspection/approval results.
- Operational Efficiency: Overall Equipment Effectiveness (OEE), inventory levels, and lead times.
2. Data Analysis Techniques
Major League Baseball:
- Performance Evaluation: Teams analyze player performance using statistical models, enabling better decision-making in player acquisitions and game strategies.
- Predictive Analytics: Teams often employ machine learning algorithms to forecast player development and game outcomes, optimizing their lineups and strategies.
Production Factory:
- Process Control: Factories use process control to monitor production processes, helping identify variations and areas for improvement.
- Lean Manufacturing: Data analysis helps in identifying waste and improving processes, driving efficiencies and cost reductions.
3. Decision-Making Processes
Major League Baseball:
- Roster Management: Teams rely heavily on player statistics to make decisions on trades, contracts, and player development. Advanced metrics provide a more comprehensive understanding of a player’s value beyond traditional stats.
- Game Strategy: Coaches and managers analyze in-game data to make real-time decisions, such as pitching changes or batting order adjustments.
Production Factory:
- Resource Allocation: Data informs decisions on workforce deployment, equipment usage, and inventory management, ensuring optimal resource utilization.
- Process Improvement: Continuous data analysis leads to informed decisions about process redesign, employee training, and technology investments.
4. Tools and Technology
Major League Baseball:
- TrackMan and Statcast: These technologies provide detailed player and ball movement data, enabling in-depth analysis of performances.
- Data Visualization Tools: Teams use dashboards and visual analytics to interpret complex datasets, making it easier for coaches and management to understand performance trends.
Production Factory:
- SpencerMetrics CONNECT: This system tracks production processes in real-time, providing critical data for analysis and reporting.
- Big Data Analytics: Companies utilize advanced analytics tools to process large datasets, uncovering patterns that lead to improved operational strategies.
5. Key Performance Indicators (KPIs)
Major League Baseball:
- Team KPIs: Winning percentage, runs scored versus allowed, and playoff appearances.
- Player KPIs: WAR, OPS (On-base Plus Slugging), and fielding metrics.
Production Factory:
- Efficiency KPIs: OEE, production throughput, and lead times.
- Quality KPIs: Defect rates, customer complaints, and return rates.
Conclusion
So, while Major League Baseball and production factories operate in vastly different arenas, the reliance on data-driven decision-making unites them. Both fields use statistical analysis to enhance performance, optimize processes, and drive strategic initiatives. By understanding the similarities in their approaches to data, professionals in both areas can glean insights that may lead to improved practices, whether on the field or in the factory.